| Title: |
Circos Plot |
| Description: |
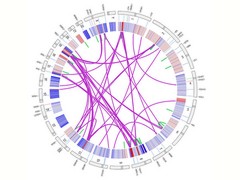
This Circos plot visualizes data from The Cancer Genome Atlas (TCGA) and allows scientists to explore the interrelationships among different data points.
|
| Topics/Categories: |
Science and Technology -- Genetics |
| Type: |
Color, Illustration (JPEG format) |
| Source: |
National Cancer Institute (NCI) |
| Date Created: |
2015 |
| Date Added: |
January 31, 2018 |
| Reuse Restrictions: |
None - This image is in the public domain and can be freely reused. Please credit the source and, where possible, the creator listed above.
|